DAVID
GONZALEZ
Data Scientist
BORKUM ANALYTICS - SUSTAINABLE TOURISM ANALYSIS
Data Sciences
Project Overview
A comprehensive data analysis project examining visitor behaviors, demographics, and sustainability attitudes on Borkum Island. Using advanced analytics and machine learning techniques, I processed survey data to extract actionable insights about tourism patterns and environmental perceptions, contributing to sustainable tourism development strategies for this North Sea destination.
Challenge
Transforming raw survey data from diverse visitors into meaningful insights about tourism behaviors, sustainability attitudes, and environmental concerns on Borkum Island. The challenge involved cleaning inconsistent survey data, developing appropriate analytical models, and creating visualizations that clearly communicated complex patterns to stakeholders without technical backgrounds.
Approach
I employed a systematic data science methodology beginning with thorough data cleaning and preprocessing of survey responses. Using R and data analysis libraries (dplyr), I applied statistical techniques to identify visitor segments and analyze their behaviors. I created insightful visualizations using ggplot2, and other visualization tools to effectively communicate findings. Throughout the process, I collaborated with team members to ensure our analyses aligned with the project's sustainability focus.
Results & Impact
- Identified 5 distinct visitor clusters with unique demographic and behavioral patterns, enabling targeted tourism strategies
- Demonstrated high visitor satisfaction (75% reporting satisfied or very satisfied) with key improvement areas in accommodation and dining
- Established that climate and price are the most influential factors affecting visitor satisfaction
- Created a comprehensive report with actionable recommendations for sustainable tourism development
Gallery
Key Features
- Interactive data visualizations communicating complex tourism patterns
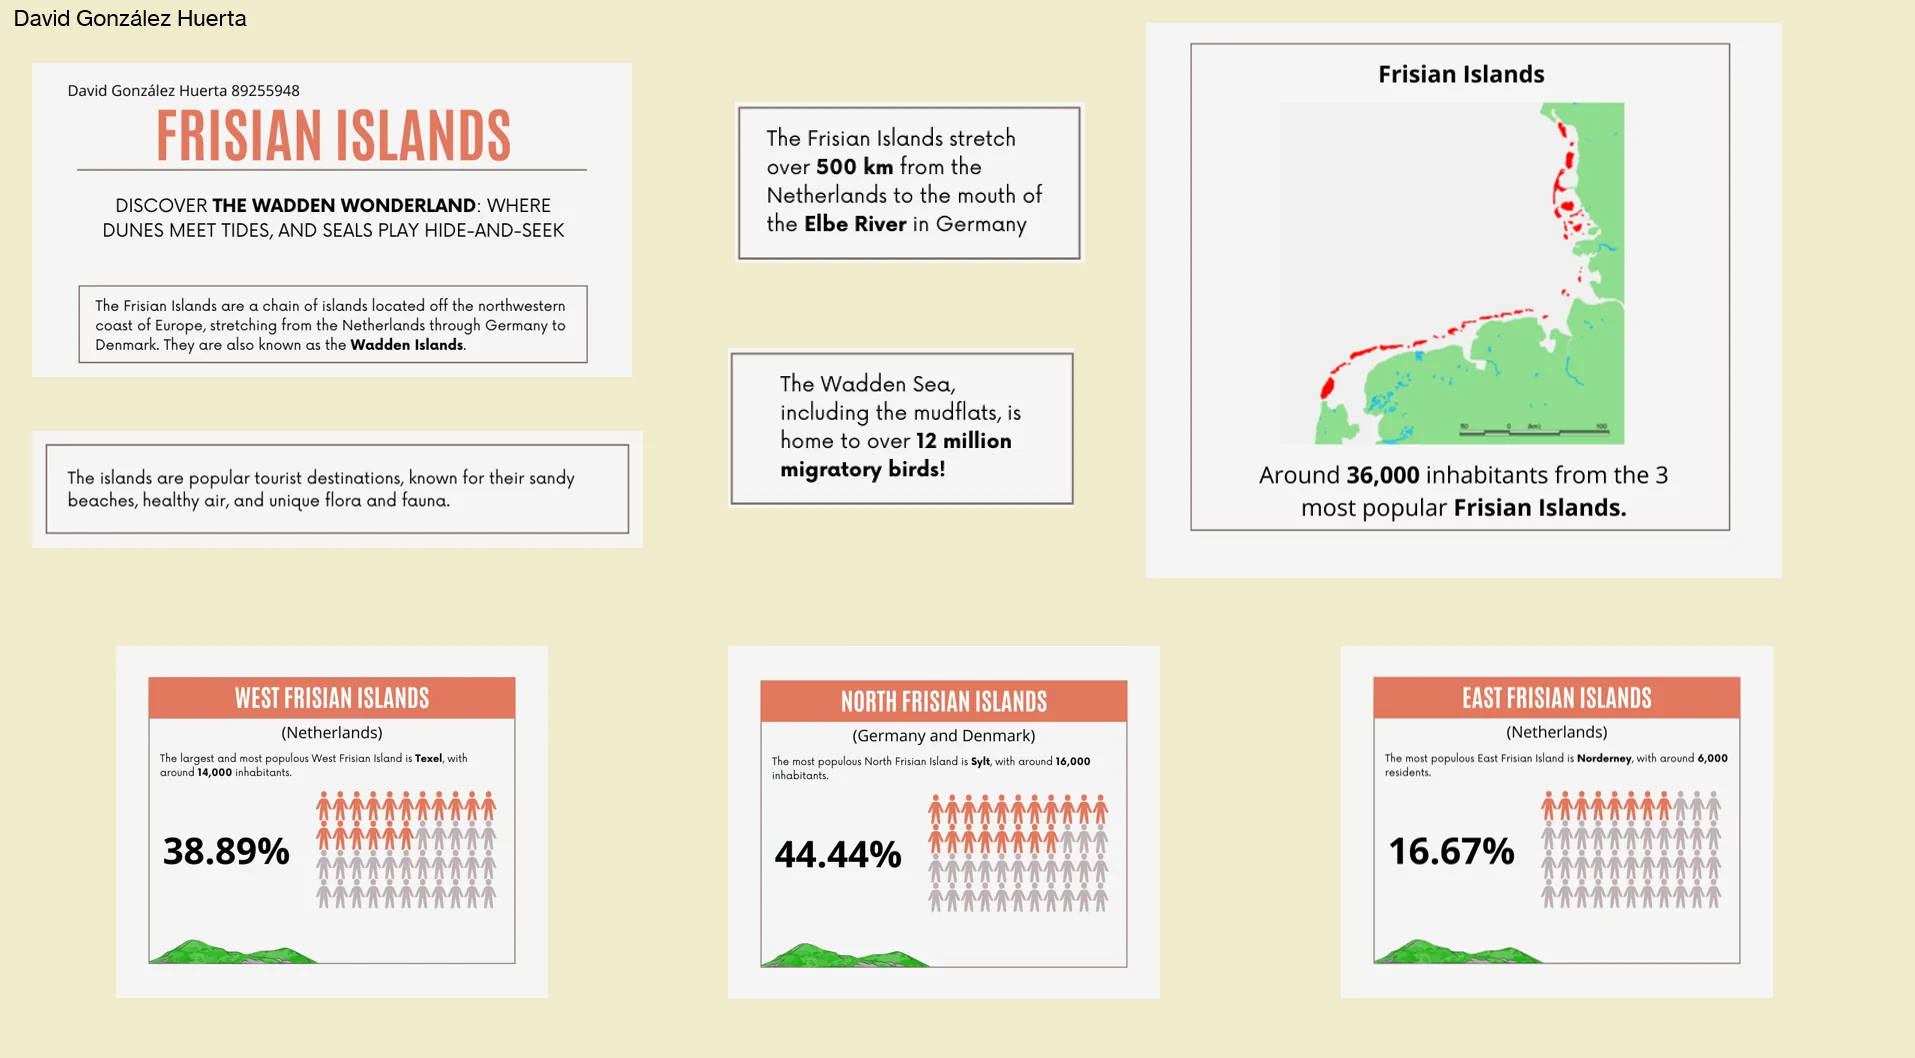
- Demographic analysis comparing residents vs. tourists
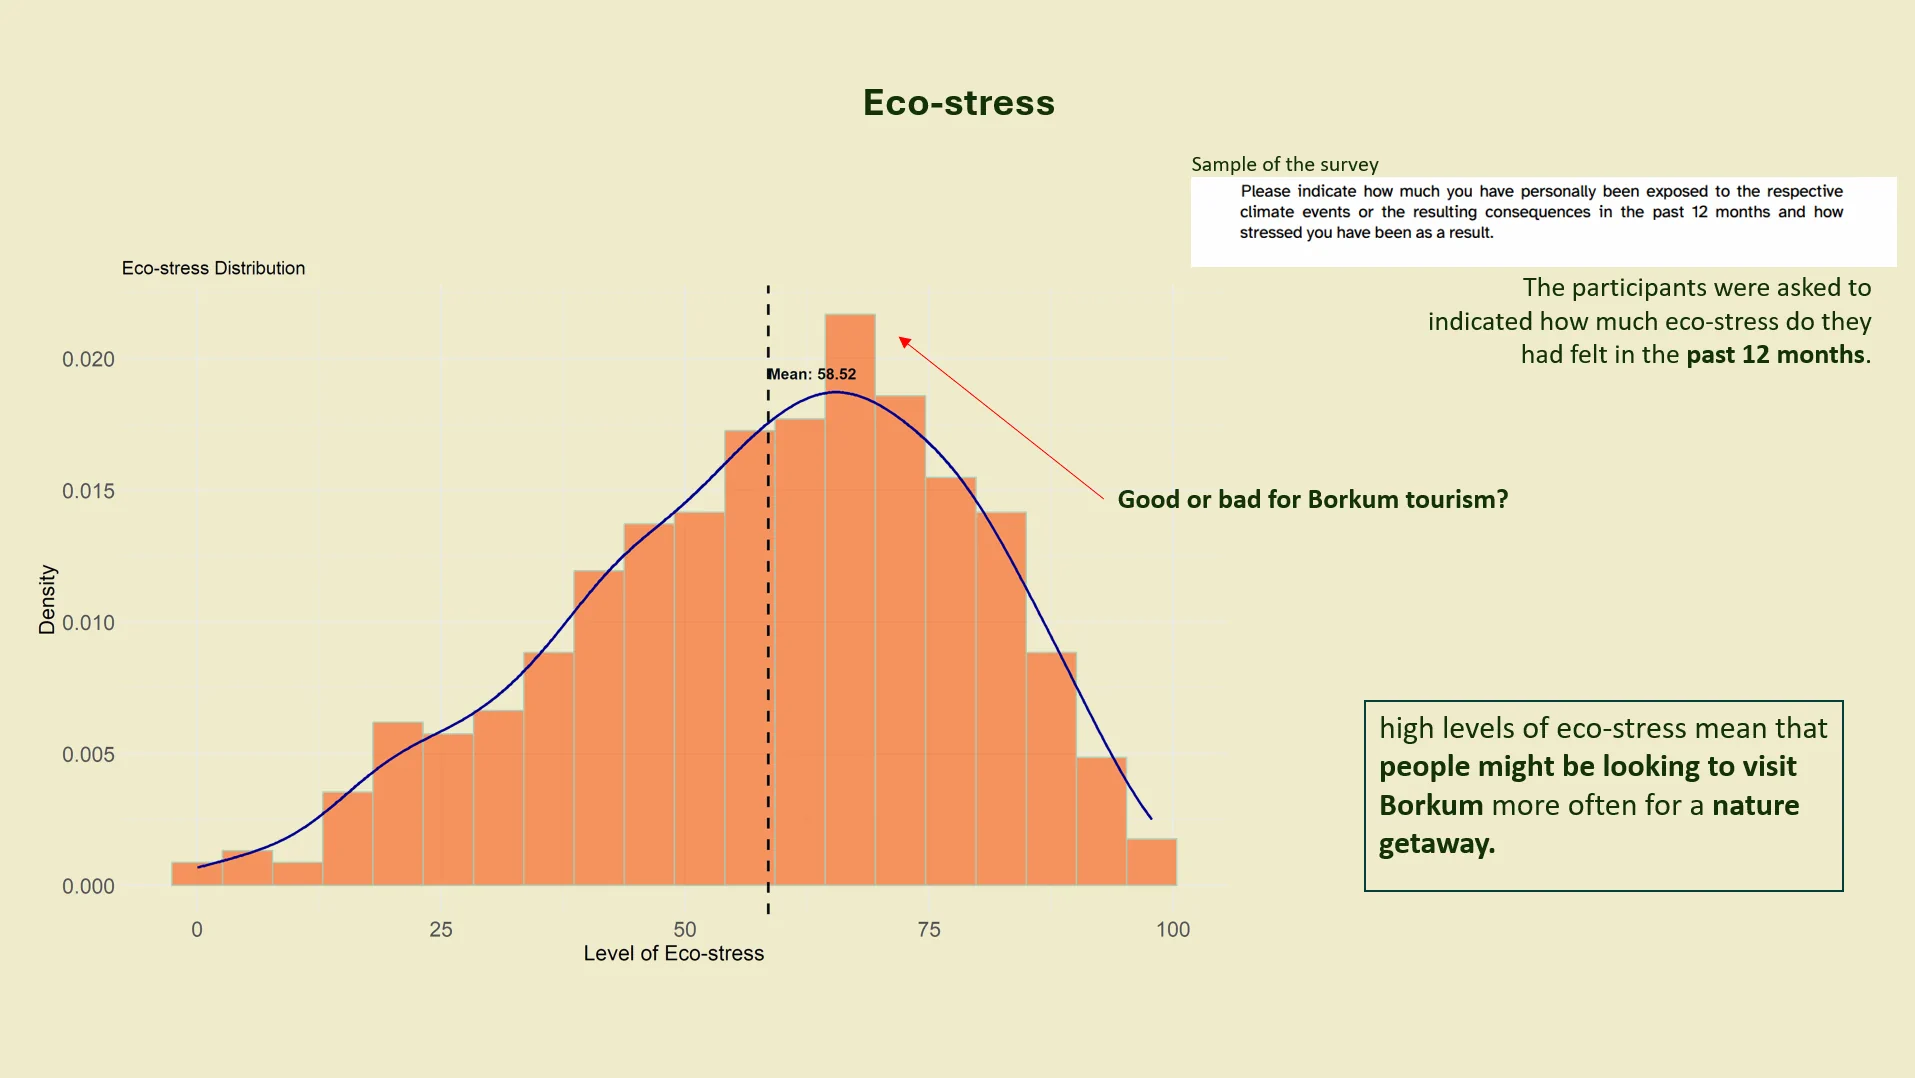
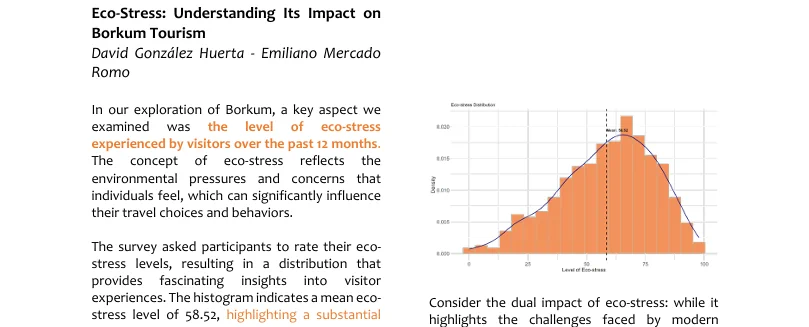
- Statistical analysis of environmental concerns and eco-stress levels
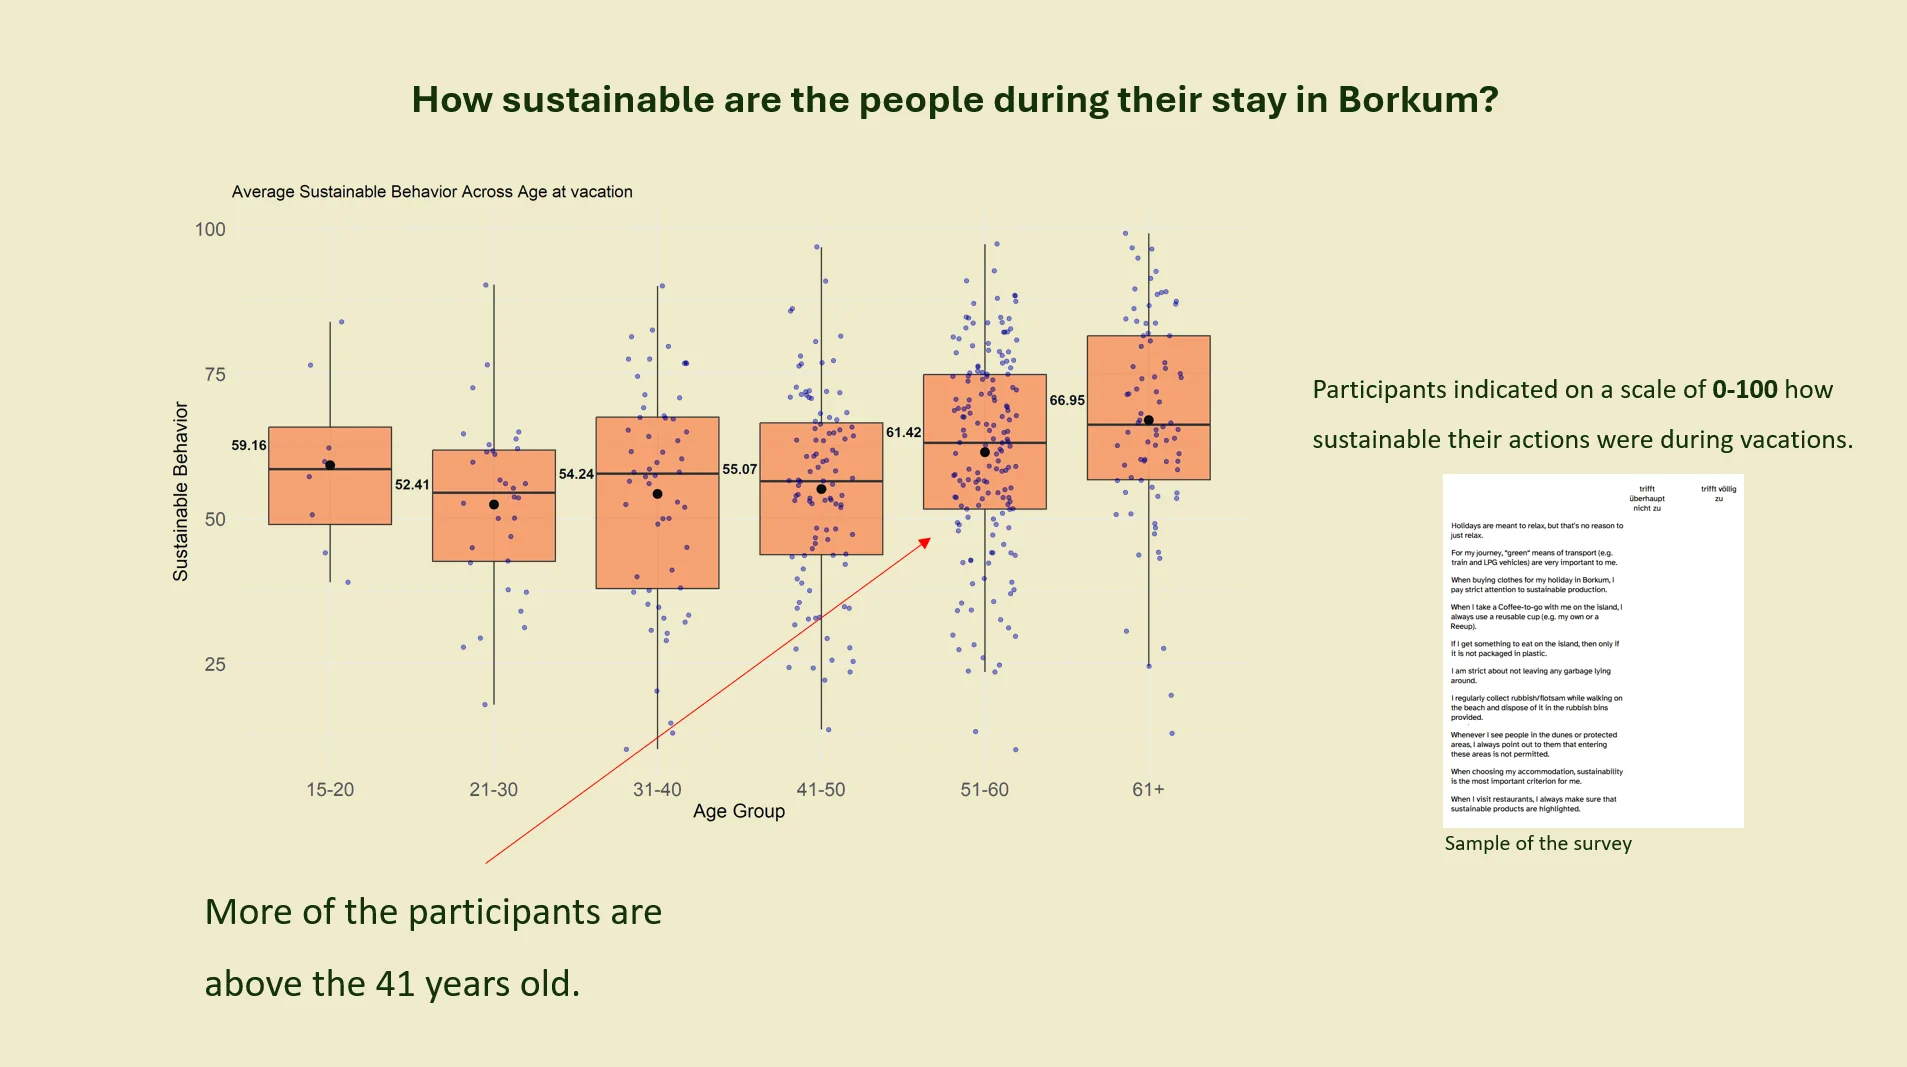
- Sustainability metrics comparing home vs. vacation behaviors
Lessons Learned
Working on the Borkum Analytics project profoundly deepened my understanding of how data science can address real-world sustainability challenges. The project taught me that effective data analysis requires more than technical expertise—it demands a contextual understanding of the subject domain. I discovered the importance of thoughtful data visualization in making complex findings accessible to non-technical stakeholders.
Future Improvements
- Implement more advanced sentiment analysis techniques to better understand visitor perceptions from open-ended responses
- Incorporating time-series data would enable tracking of sustainability trends across multiple seasons